
GNLP 2045 Regulation 20 Scoping Consultation
Other elements in this consultation
4. Growth Strategy and Settlement Hierarchy
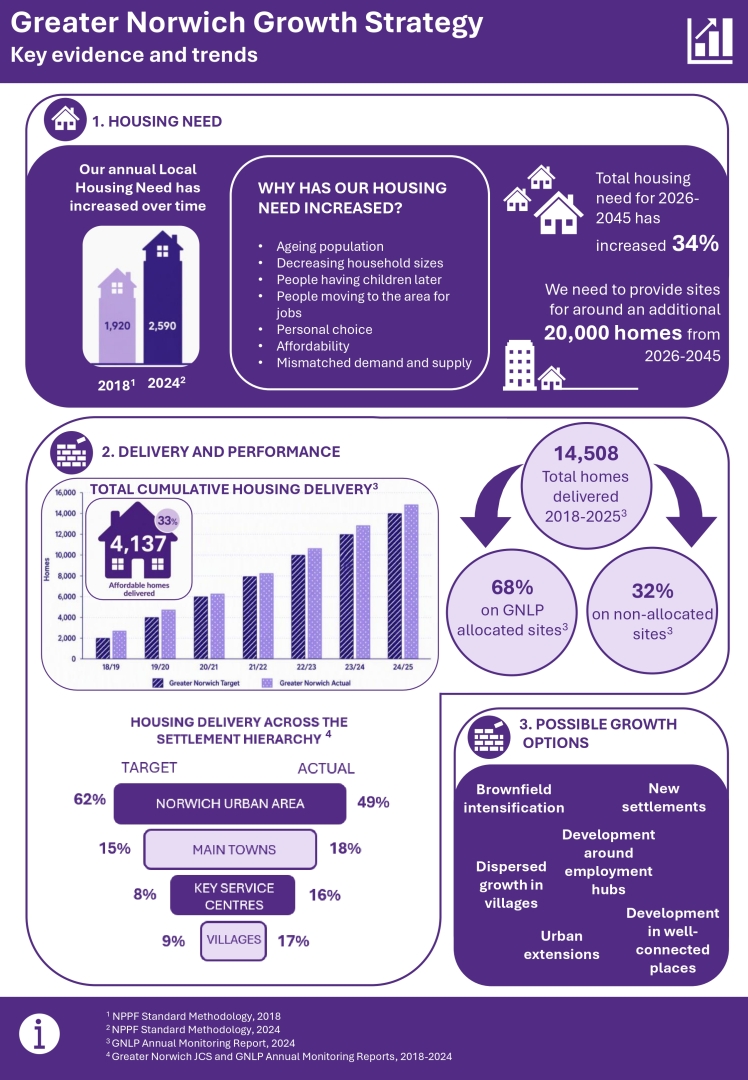
Greater Norwich Growth Strategy - Key evidence and trends (full text)
1. HOUSING NEED
Our annual Local Housing Need has increased over time
From 1,920 homes per annum in 2018[1]
To 2,590 homes per annum in 2024[2]
Why has our housing need increased?
- Ageing population
- Decreasing household sizes
- People having children later
- People moving to the area for jobs
- Personal choice
- Affordability
- Mismatched demand and supply
Total housing need for 2026-2045 has increased 34%.
We need to provide sites for around an additional 20,000 homes from 2026-2045.
2. DELIVERY AND PERFORMANCE
Housing delivery summary
A graph showing total cumulative housing delivery3 in Greater Norwich from 2018/19 to 2024/25. Each year actual delivery has exceeded the annual target.
4,137 affordable homes have been delivered across Greater Norwich since 2018/19. This equates to 33% of total delivery during that time period.
14,508 Total homes delivered 2018-2025[3].
68% On GNLP allocated sites³.
32% On non-allocated sites³.
Housing delivery across the settlement hierarchy[4]
Target
- Norwich Urban Area: 62%
- Key Service Centres: 15%
- Main Towns: 8%
- Villages: 9%
Actual
- Norwich Urban Area: 49%
- Key Service Centres: 18%
- Main Towns: 16%
- Villages: 17%
3. POSSIBLE GROWTH OPTIONS
- Brownfield intensification
- Urban extensions
- New settlements
- Dispersed growth in villages
- Development around employment hubs
- Development in well-connected places.
References
[1] NPPF Standard Methodology, 2018.
[2] NPPF Standard Methodology, 2024.
[3] GNLP Annual Monitoring Report, 2024.
[4] Greater Norwich JCS and GNLP Annual Monitoring Reports, 2018-2024
A2.2 The growth strategy and the settlement hierarchy
What is a growth strategy?
1The growth strategy for a local plan sets out how, where, and when development will take place over the plan period, from 2026 to 2045 in the case of the review of the GNLP. It directs the scale, distribution, and form of future development, such as housing, employment, infrastructure, and services. It aims to achieve national sustainable development objectives whilst also meeting evidenced needs and reflecting local constraints and priorities such as areas of flood risk and the impacts of growth on the landscape.
2A growth strategy typically includes:
- The scale of growth
- How much development is needed (e.g. the number and types of homes and how much additional employment land is required).
- Spatial distribution
- Where development should go (e.g. what proportion of the growth should be in the Norwich Urban Area, the main towns, the key service centres, villages and in any new settlements).
- The pattern of development
- The form growth will take (e.g. regeneration and densification of existing brownfield sites, new urban extensions, new settlements and growth in certain towns and villages).
- Phasing and timing
- When development should occur across the plan period (2026 – 2045) e.g. will some development will take place early on in the plan period whilst other growth be phased to commence later on.
- Infrastructure alignment
- How growth will be appropriately supported by transport, schools, healthcare, utilities, green infrastructure and other key infrastructure.
- Sustainability principles
- Ensuring development supports economic, social, and environmental objectives (e.g. climate change mitigation, accessibility, biodiversity etc).
What is the adopted growth strategy?
3Greater Norwich’s currently adopted growth strategy is set out in Policy 1 (The Sustainable Growth Strategy) of the 2024 adopted GNLP and is illustrated in the plan’s key diagram (see below), with further detail in policies 7.1 to 7.4. The GNLP has a long-standing strategic approach to growth which builds on the earlier Joint Core Strategy (2011).
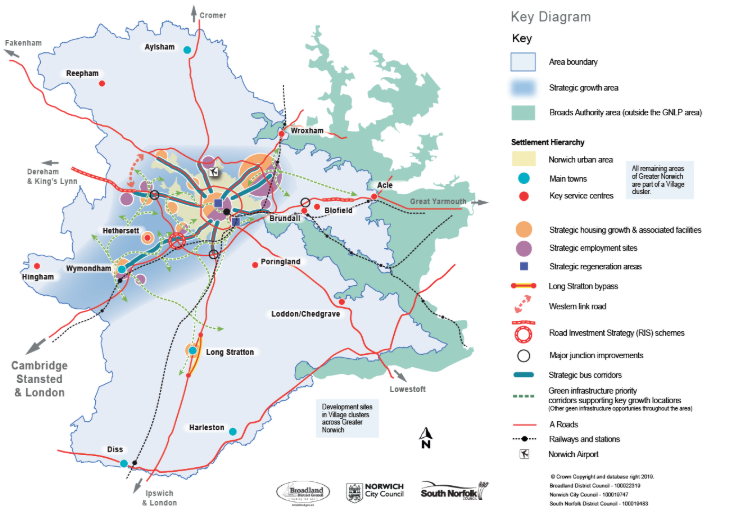
4GNLP Policy 1 states that ‘most of the housing, employment and infrastructure growth is focused on the Strategic Growth Area’, as identified in the Key Diagram. The strategic growth area includes the Norwich Urban Area, Wymondham and Hethersett and key employment sites such as the Norwich Research Park, Hethel and the Food Enterprise Park.
5Paragraph 166 of the GNLP summarises the strategic approach taken in the plan, stating:
- To ensure sustainable development, minimise carbon emissions, promote strong, resilient, inclusive and vibrant communities and meet other Government requirements set out in the NPPF, the strategy for the location of growth:
- Maximises brownfield development and regeneration opportunities, which are mainly in Norwich. The brownfield/greenfield split for new homes in the plan is around 22%/78%.
- Broadly follows the settlement hierarchy set out in policy 1 (the Norwich urban area; main towns; key service centres and village clusters) in terms of scales of growth as this reflects access to services and jobs.
- Focusses most of the growth in locations with the best access to jobs, services and existing and planned infrastructure in and around the Norwich urban area and the Cambridge Norwich Tech corridor.
- Focusses reasonable levels of growth in the main towns, key service centres and village clusters to support a vibrant rural economy. The approach to village clusters is innovative. It reflects the way people access services in rural areas and enhances social sustainability by promoting appropriate growth in smaller villages. It will support local services, whilst at the same time protecting the character of the villages.
- Allocates strategic scale housing sites (750 dwellings +) in accessible locations.
- Allocates a significant number of medium scale and smaller scale sites in the urban area, towns and villages, providing a balanced range of site types to allow for choice, assist delivery and allow smaller scale developers and builders into the market. Overall, 12% of the homes allocated through the plan are on sites of no larger than 1 hectare, meeting NPPF requirements. More small-scale housing developments will be provided by policy 7.5 and through windfall development.
- Sets a minimum allocation size of 12-15 dwellings to ensure that a readily deliverable amount of affordable housing is provided on all allocated sites
6The GNLP growth strategy can be described as a ‘blended’ approach. The major focus for growth is the Strategic Growth Area as outlined above. The plan includes brownfield intensification, significant urban extensions to higher-order settlements, smaller site allocations around lower order key service centres and the allocation of growth in village clusters to support rural communities. More detailed commentary is provided in table 4 below to show how delivery of the adopted Growth Strategy is progressing in the context of the settlement hierarchy.
7Many of the allocations in the adopted GNLP are currently being delivered demonstrating the strength of the Growth Strategy. Good quality sites have been identified, allocated and unlocked with an appropriate mix of planned housing, employment and infrastructure being delivered and occupied.
8Housing need for both the JCS and the GNLP has been around 2,000 homes per year. Delivery for the part of the JCS plan period from 2011/12 to 2017/18 met just below 80% of the total housing need at that time. Evidence detailed further below (see paragraphs 16 to 19 and tables 1, 2 and 3 below) shows that the adopted GNLP growth strategy has resulted in consistent and strong housing delivery since its base date of April 2018, so that overall housing delivery was marginally above the plan’s targets from April 2018 to April 2025.
9There has also been on-going delivery of high-quality employment sites which will support businesses to grow in the future. However, the long-term trend of reduced employment in the city centre has continued. Employment evidence below provides further details (see table 4 and paragraph 19).
10Table 4 below shows that most of the growth to date has been focused in the Norwich Urban Area with significant delivery around the urban fringe. Whilst delivery in percentage terms from 2018 to 2025 has been below target, many of the largest strategic and most complex allocated brownfield and greenfield sites are now also making significant progress in terms of planning, funding and enabling infrastructure. It is likely that this will drive significant housing delivery over future years, recognising that strategic sites have longer lead-in times prior to first delivery than smaller sites.
11There has also been significant growth around Greater Norwich’s main towns, including Wymondham and Aylsham, and key service centres such as Loddon and Hethersett. The recent delivery of the Long Stratton bypass will also unlock significant plan-led growth in Long Stratton.
12Delivery in rural areas, both planned and windfall, has also been strong.
13Depending on evidence, it is anticipated that the majority of the allocations in the adopted plan which have not yet been developed will be carried forward into the GNLP 2045, forming a key part of the updated growth strategy. In relation to housing, this means that we already have allocated sites and sites with planning permission to meet 60% of the total need from 2026 to 2045. Due to the new local housing need, and dependent on assumptions that are made for windfall and providing a delivery buffer in plan-making, it seems likely that the GNLP 2045 will need to provide sites for around an additional 20,000 homes from 2026 to 2045.
What is the settlement hierarchy and how does it relate to the growth strategy?
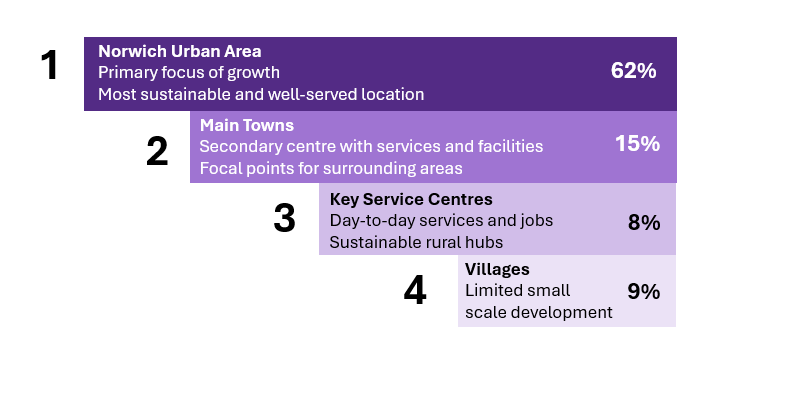
14A settlement hierarchy is a way of ranking settlements according to their size, role, function and level of services and infrastructure. Establishing a settlement hierarchy is an important part of developing the growth strategy for a local plan as it provides a structured approach to informing where different types and scales of development should be directed. The settlement hierarchy in the adopted GNLP is outlined in the infographic below, including the overall percentage of GNLP growth planned at each level.
15Table 3 below sets out more detail about the settlement hierarchy in the adopted GNLP. It lists the settlements that are included in each layer of the hierarchy and gives a high-level summary of the progress being made to deliver on the Growth Strategy in the key locations within each ‘tier’ of the hierarchy.
How much growth has been delivered to date?
16This section provides more detailed analysis of housing and employment delivery from the adopted GNLP base date of April 2018 to April 2025. The Annual Monitoring Report (AMR) data shows that good progress has been made to deliver the growth strategy and meet the annual requirement of approximately 2,000 homes per year across the Greater Norwich area. Tables 1 and 2 show that overall housing delivery for this period is slightly ahead of schedule.
17Windfall delivery has been strong throughout this period, providing 32% of all housing.
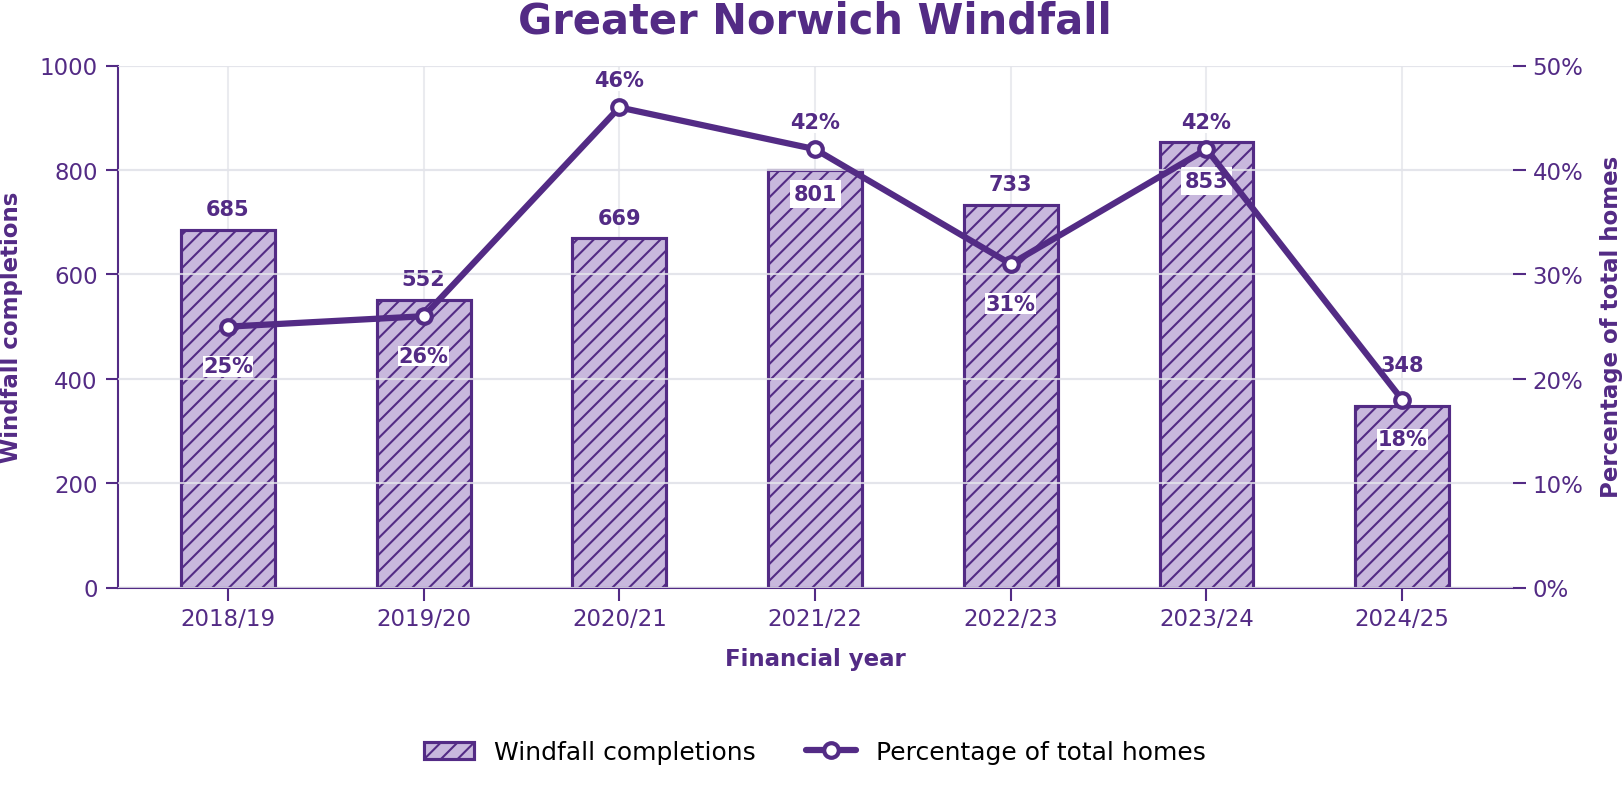
Table 1 - Net annual housing delivery figures for Greater Norwich
|
Area |
2018/19 |
2019/20 |
2020/21 |
2021/22 |
2022/23 |
2023/24 |
2024/25 |
|
Greater Norwich delivery |
2,779 |
2,075 |
1,468 |
1,890 |
2,358 |
2,340 |
1,893 |
Table 2 - Cumulative net homes delivered in Greater Norwich.
|
Area |
18/19 |
19/20 |
20/21 |
21/22 |
22/23 |
23/24 |
24/25 |
| Greater Norwich Target | 2,027 | 4,054 | 6,081 | 8,108 | 10,098 | 12,088 | 14,078 |
|
Greater Norwich Actual |
2,779 |
4,854 |
6,322 |
8,212 |
10,570 |
12,910 |
14,803 |
18There was a drop off in delivery figures during the 2024/2025 monitoring period compared with previous years which is likely to continue into 2025/26. This is not unique to Greater Norwich, as it is a trend reflected nationally. Causes include major increases in materials and construction costs, significant increases in financing costs resulting from macroeconomic and inflationary factors; cost increases due to nutrient neutrality requirements, the introduction of Biodiversity Net Gain and changes to Building Regulations resulting from the Building Safety Act post-Grenfell; and reduced buyer demand given the recent cost of living challenges and withdrawal of Government-led demand-side support measures (i.e. Help to Buy). Locally, nutrient neutrality has also impacted the delivery of some sites in and around Norwich.
19The growth of research-based industries is a key part of the growth strategy for Greater Norwich. Across Greater Norwich over half of the workforce was employed in groups 1 to 3 (professional jobs) in 2024/25. Greater Norwich is performing positively in comparison to national figures, with more of the workforce in groups 1 to 3 in Greater Norwich than nationally. Tied to this, whilst average earnings remain slightly below the national average, over the last three years the difference between the national average and Greater Norwich average has decreased as the research economy has grown. Table 4 below provides some detail on employment site delivery.
The Strategic Growth Area
20Table 3 below shows that, particularly in recent years, housing delivery is generally coming forward in the Strategic Growth Area (SGA) as allocated in the GNLP, reflecting the success of the plan in concentrating delivery in the most sustainable part of our area. This pattern is likely to continue as large scale urban extensions build out and the strategic regeneration sites in Norwich are developed.
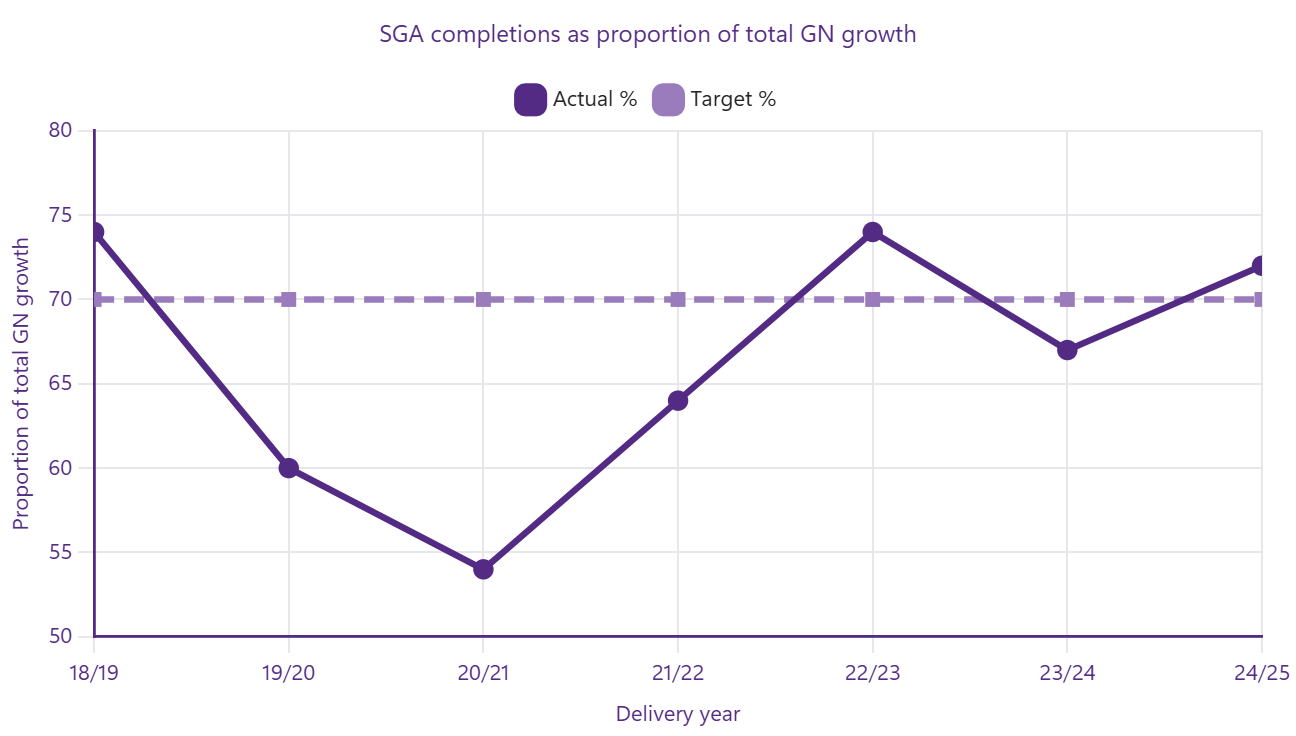
Table 4 The adopted GNLP Settlement Hierarchy and its delivery
|
Tier |
Role and percentage of total housing growth |
Settlements |
Progress Update |
|
Norwich Urban Area (NUA) |
This is intended to be the primary focus of growth (totalling 62% of total housing) and nearly all of the strategic employment sites. This reflects the urban area’s role as the most sustainable and well served location in Greater Norwich. |
Norwich Built-up parts of the fringe parishes: Colney, Costessey, Cringleford, Drayton, Easton, Hellesdon, Old Catton, Sprowston, Taverham, Thorpe St Andrew, Trowse and the remainder of the Growth Triangle (the strategic urban extension area to the northeast of Norwich) |
Just over 7,100 homes were delivered in the NUA between April 2018 and April 2025. This is 49% of total housing delivered, which is below the 62% GNLP target for the whole plan period. Apart from 2018/19, delivery in this tier of the hierarchy was generally low early in the GNLP plan period to 2020/21 but has significantly picked up since. Delivery in Norwich varied year on year as brownfield sites, homes at the Three Score green field urban extension and student accommodation were delivered. Just under 2,900 homes were delivered in total from 2018 to 2025. Major milestones have been achieved recently at the Strategic Regeneration Areas at East Norwich (which will provide round 3,500 homes) and Anglia Square (which will provide around 1,100 homes and other uses). Major public and private sector investment is being made at Anglia Square. Land assembly has been secured; permission has been granted and enabling works, including demolition, are underway. Progress is also being made at East Norwich, with public sector investment secured. Delivery of the first new homes at East Norwich is anticipated within two years. The Northeast Growth Triangle is now delivering at Beeston Park and North Rackheath which will provide around 8,000 homes in the long term, along with employment, amenities and infrastructure. Significant recent progress has been made with planning approvals secured, enabling infrastructure being provided and around 1,200 homes delivered in the whole Growth Triangle from 2018 to 2025. As a result, strong housing delivery is anticipated in the coming years. There has been significant housing growth at Cringleford with around 850 homes built from 2018 to 2025. Since 2018 significant progress has been made in terms of the build out of strategic scale housing schemes at Easton (around 320 homes), Hellesdon (290 homes), Drayton (200 homes) and Taverham (100 homes). There has been further delivery in 2025/26 and there will be further build out on many of the large sites in the coming years. Major progress is also being made at Marriott’s Park, Taverham which will provide around 1,500 homes. Planning permissions have been granted, and delivery is anticipated to commence shortly. Recently, there has also been strong employment delivery at strategic sites at Broadland Gate, Norwich Research Park (NRP), the Food Enterprise Park and Longwater. Significant further employment delivery is in the pipeline, especially for research facilities at NRP and general uses at other strategic employment sites. Despite growth in the digital creative sector in the city centre, overall office space and job numbers have reduced here. |
|
Main Towns |
Secondary centres for significant growth (15%). They provide a range of services, employment, and facilities and act as focal points for surrounding rural areas. |
|
Just below 2,600 homes were delivered in the main towns between 2018 and 2025. This is 18% of the total housing delivery for Greater Norwich, which is above the GNLP 15% target for the whole plan period. Wymondham has had significant growth over the last decade with many of the strategic housing sites well progressed or complete. Around 1,850 homes were completed between 2018 and 2025. Delivery has also been strong at other main towns between 2018 and 2025. Diss saw the delivery of around 300 homes, and Harleston around 175. Elsewhere, permission has been granted at Aylsham for around 250 homes, with build out starting at Norwich Road. The Long Stratton bypass opened in 2025, with strategic sites permitted for around 1,900 homes and progress to delivery being made. The delivery of employment sites and improved infrastructure has supported this housing growth. |
|
Key Service Centres |
Smaller settlements which provide day to day services and local employment and act as a network of sustainable rural hubs. They provide for 8% of growth. |
|
Delivery has been strong in the key service centres, with around 2,340 homes delivered between 2018 and 2025. This is 16% of total housing delivered, well above the 8% target for the whole plan period. Significant progress was made in the extension of Hethersett between 2018 and 2025 with the delivery of nearly 800 homes and delivery continuing in 2025/26. Significant numbers of new homes were also delivered between 2018 and 2025 at Acle (around 240), Blofield (350), Brundall (130), Loddon/Chedgrave (200) and the Poringland area (360). Many of the above schemes will deliver further housing through current planning permissions. |
|
Village Clusters |
Limited, small-scale development providing some growth to support existing services (9%). |
Remaining parishes in Greater Norwich. |
Delivery has also been strong in the village clusters, with just over 2,400 homes delivered between 2018 and 2025. This is 17% of total housing delivered, which is well above the 9% target for the whole plan period to 2038. In addition, the South Norfolk Village Clusters Housing Allocation Plan is close to adoption. |
Question 4 - Which elements of the existing growth strategy and settlement hierarchy do you think have and have not worked well?
How much growth do we need to plan for in GNLP 2045 and what does this mean for the growth strategy and settlement hierarchy?
Overall Housing Need and Requirement
21In line with the government’s agenda to significantly increase the delivery of housing to address the housing crisis, local housing need (LHN) in Greater Norwich has risen from figures of around 2,000 homes per year which the JCS and GNLP planned for to around 2,600 homes per year which the GNLP 2045 will need to plan for.
22There are several reasons why there is a now a need for additional homes both across the country and in Greater Norwich. These include:
- An ageing population with increased life expectancy.
- Decreasing household sizes - more people are living on their own at all life stages.
- Delayed household formation - people are having children later.
- Economic growth - people move to areas where jobs are being created such as Greater Norwich.
- Retirement – the quality of the place and environment means that Greater Norwich attracts people seeking to relocate in retirement.
- Personal preferences for better quality or different types of housing.
- Affordability constraints – there is ‘latent’ demand from people living with their families or in house-shares for longer than they would historically have due to high housing costs.
- There is a mismatch between demand and supply in specific locations.
23The housing need in a local plan is the number of homes that are needed, based on existing housing stock and affordability. It is calculated using the national standard method, which was revised in December 2024 and is set out in the national Planning Practice Guidance (on Housing and Economic Needs Assessment). The housing requirement is the number of homes actually planned for, after applying real-world constraints and policy decisions.
24Using figures updated in May 2026, the standard method calculates Greater Norwich’s LHN to be 2,590 homes per year. This is a 34% increase from the targets which informed the adopted GNLP.
25Most local plans include a buffer of around 10% of additional homes above the housing need in their housing requirement. This is to ensure there is extra potential housing that could be delivered to account for sites that may not come forward or are significantly delayed. Sites might not deliver housing for a variety of reasons, which can include increased costs and unexpected site conditions, and these are not always foreseeable. The adopted GNLP includes an 11% buffer.
26It may also be necessary for the GNLP 2045 to consider cross-boundary needs to establish its housing requirement. Joint evidence is currently being collected to assess whether other local plans currently being developed in Norfolk can address their own housing needs.
27Apart from the Broads Authority area (which produces its own local plan), Greater Norwich has no extensive national designations, such as National Landscapes, and there is no designated Green Belt. Currently, around 11% of the land is Greater Norwich is built on, comparable to the figure for England as a whole (10.5%). Development in recent local plans in our area has been located to avoid impacts on designated habitat sites such as Sites of Special Scientific Interest (SSSIs) and Special Areas of Conservation (SACs).
28Ahead of the production of a new Spatial Development Strategy (SDS) for Norfolk and Suffolk, successful existing on-going cooperation between the Norfolk LPAs, and working more closely with Suffolk LPAs, should play a key role in smoothing the transition to local government reorganisation and the establishment of a mayoral authority.
29Along with planning for a significant increase in the number of homes, the GNLP 2045 will also need to plan for an appropriate quantum and distribution of employment uses and related infrastructure. Unlike the local housing need which is calculated using the nationally established standard method, we will need to collect evidence to show what the additional employment and infrastructure needs are. These will be established based on local evidence.
30The requirement to plan for c. 20,000 more homes and associated employment and infrastructure uses raises the question about how and where further growth should be accommodated, including how the current growth strategy and associated settlement hierarchy should be amended to provide for the additional housing needs and other types of growth.
31At this stage potential growth strategy options have not been developed or tested as we will need to establish a robust technical evidence base with a detailed analysis of constraints, opportunities, potential sites, demand and need, before considering and testing the different forms of potential additional growth. This will include consideration of the potential for further brownfield intensification, extensions to existing towns and villages and potentially standalone new settlements. Consideration of the options and trade-offs of the different approaches, and implications for existing places and communities will be essential.
Updating the growth strategy
32When updating the growth strategy consideration will need to be given to the feasibility of including different development types to bring forward the housing numbers and other growth that we need. These could include:
- Brownfield intensification
- Strategic urban extensions to existing higher order settlements (>1,000 homes)
- Large urban extensions (500-1,000 homes)
- Smaller urban extensions (<500 homes)
- Standalone new settlements (4,000+ homes)
- Dispersed growth focused on villages
- Employment anchored development
- Transit-oriented and connectivity-focused development
33In addition, we will need to look holistically at the pattern and distribution of additional growth e.g. which existing settlements or locations have the potential capacity for additional growth and/or where might potentially be able to accommodate standalone new settlements.
34The starting point, consistent with national policy and the current approach of the GNLP, will be to take a ‘brownfield first’ approach. The draft NPPF places a major focus on intensification of development in existing urban areas, in particular near railway stations with good levels of service and in and around centres such as Norwich city centre, town and district centres. As well as allocating sites for brownfield development, potentially at higher densities than previously, there is the possibility of including policies in the plan which encourage more windfall development on smaller non-allocated brownfield sites to come forward.
35However, it is important to note that only 22% of the current GNLP housing numbers will be delivered on brownfield sites as there is an overall lack of significant, strategic brownfield sites capable of accommodating housing delivery at scale. In addition, brownfield sites are often very challenging to deliver, requiring significant public sector investment to de-risk sites which typically generate abnormal costs in terms of ground conditions, contamination, land assembly and infrastructure. The financial viability of many brownfield sites, mainly in Norwich, is currently limited.
36Maximising the use of land within existing settlements can support sustainable development by making good use of existing infrastructure, services, and public transport. However, the capacity of settlements to accommodate additional growth will vary and it is likely the urban extensions will be required. These are likely to vary from strategic scale extensions to higher order settlements to smaller scale extensions on the edge of lower order settlements.
37As well as extensions to existing settlements there is also the opportunity to consider the delivery of a standalone new settlement, or settlements. The adopted GNLP includes supporting text at paragraphs 164 to 165 committing to exploring new settlements as part of any subsequent local plan review, so it is proposed that this potential is explored as part of this plan-making process.
38New settlements can offer opportunities for comprehensive planning, infrastructure delivery, and placemaking, but can also present challenges in terms of viability, delivery timescales, and infrastructure provision. It is critical that appropriate infrastructure, both on and offsite, is delivered to support new settlements.
39It is important to bear in mind that new settlements are long term projects which will take decades to fully develop. Current evidence from elsewhere in England suggests that any new settlement which is adopted within this plan would deliver at a maximum rate of around 300 homes per year, with the first homes likely to be delivered no earlier than in the mid-2030s. As a result, even if one or more new settlement(s) is progressed through this plan, new settlements could only be part of the overall growth strategy and other growth locations will inevitably be required to help meet the need for around 20,000 additional homes from 2026 to 2045. It is also clear that any new settlements will continue to deliver well after 2045.
40Consideration could also be given to alternative ways of ‘anchoring’ future growth to the traditional settlement orientated growth strategy– i.e. transit-oriented development (i.e. focusing growth and density around existing transport nodes such as bus routes or train stations), focusing on connectivity (which could utilise the Department for Transport’s Connectivity Tool), or employment-oriented development (i.e. focusing future growth around existing employment nodes). There could be overlap between these categories with a settlement-oriented growth strategy, but they are worthy of exploration.
41However it is done, planning for around an additional 20,000 homes will have significant implications for transport, utilities, education, healthcare, and green infrastructure, amongst other issues. Identifying priorities and highlighting constraints and/or opportunities that should inform the updated growth strategy is important.
42The growth strategy must be realistic and achievable, taking account of market conditions, infrastructure funding, and build-out rates. This is particularly relevant when considering larger-scale developments such as new settlements, which have longer lead-in times and for brownfield sites, which often have additional costs associated with development, such as for demolition and decontamination.
43For larger sites particularly, some new/improved infrastructure will normally be required up-front or very early in the development lifecycle. However, much typically can be delivered on a phased basis as the site progresses.
44Whilst some larger new developments may perhaps be able to address or improve some existing infrastructure shortcomings in providing for their own impacts, they cannot normally be required to deal with existing deficits elsewhere, unless such gaps are critical to their own delivery.
- How can the GNLP 2045 support the development of brownfield sites?
- What development types would you support as part of our updated Growth Strategy?
Question 6 - What areas do you consider to be appropriate for additional growth and what infrastructure, services and amenities would need to be prioritised to enable growth in these locations?
Updating the settlement hierarchy
45Establishing the best approach to be taken to update the settlement hierarchy will be a key element of GNLP 2045. Traditionally the settlement hierarchy has classified settlements based on their size, population and availability of services and facilities (collected via an audit) to determine which areas are the most sustainable for development, with a typical focus on the higher tiers of the hierarchy as they tend to have better connectivity, accessibility and infrastructure.
46However, this approach has its limitations because it looks at places in isolation and at a fixed point in time. It does not consider how people can travel sustainably between settlements to access services and facilities elsewhere and how these patterns of movement can help to support local services and facilities, particularly in rural areas.
47An alternative approach could be to use the Connectivity Tool published by the Department for Transport (DfT). This tool gives an overall connectivity score for settlements based on ability to access everyday services, employment and social engagements via public transport and active travel. Use of the tool is supported by the Ministry for Housing, Communities and Local Government (MHCLG) and is being explored by other local authorities.
48Other options may exist including some combination of the traditional approach and using the connectivity tool and more work will be done to explore all the options available.
49If a new approach is used it will be necessary to determine how settlements are classified within the hierarchy and whether the current classification remains appropriate. Some settlements may have changed in recent years due to new development, infrastructure or changes in services. The GNLP 2045 provides an opportunity to review whether their place in the hierarchy as set out in table 4 above remains appropriate or whether it should be updated.
50Careful consideration will need to be given to planning for growth in rural settlements at the lower end of the settlement hierarchy. The draft 2025 NPPF states that to support a diverse mix of sites local plans should allocate land to accommodate at least 10% of their housing requirement on sites no larger than one hectare and also allocate sites to support and enhance the vitality of rural communities and enable villages to grow and thrive, especially where this will support local services.
51With regard to rural settlements, the adopted GNLP introduced a village clusters approach based on the shared services available in groups of villages. Allocations were then made within each village cluster focusing primarily on a safe walking route to the local primary school. Prior to this, the approach taken in the Joint Core Strategy (JCS) (2011) and earlier local plans had been to group villages into “service villages”, “other villages” and “smaller rural communities”, with allocations only being made within service villages as these had the greatest level of services and facilities. Other villages allowed for some windfall development within defined settlement boundaries and smaller rural communities were classified as open countryside where new development was not deemed acceptable. We will need to consider which approach to the classification of villages is most appropriate within the GNLP 2045 settlement hierarchy. It could be one of the approaches outlined above or something different.
